My parents came to visit me in Malawi back in December, and this did wonders for my mom’s level of concern about my welfare. She was able to see that Malawi at least looks relatively safe. We got to discussing safety and violence after the horrific murders of 20 kindergarteners that month. I made the off-hand claim that I am physically safer here than in the US. I’ve heard about awful crimes in both places, but I’m convinced in particular that my chances of being murdered are much lower here.
A couple of weeks ago I got around to looking that up to see whether the data confirmed my guess. I quickly found this Wikipedia page listing the intentional homicide rate for every country, which reports murder statistics from the UN Office on Drugs and Crime (UNODC). The UNODC figures assert that Malawi has an intentional homicide rate of 36.0 per 100,000 people, which is the twelfth-highest murder rate in the world. That’s a truly horrific figure, if true. It’s more than any US city save Detroit and New Orleans, but just 20% of Malawians live in urban areas.
I cannot possibly square that high of a murder rate with my experience here. I collected the data for my survey in Traditional Authority Mwambo, a rural area that conveniently has about 100,000 people in it. I was there for about 4 months, and during that time I befriended all of the local authorities, especially the police. In managing my research team, I was very cognizant of crime and our personal security, and pursued any and all rumors with my friends at the Jali and Kachulu police stations and at the local road traffic police as well. For their part, they were very open about the cases they were dealing with, and at one point the Jali police actually helped us find a different, more-secure place to stay out there. If Mwambo matched the national average, you’d expect 12 murders there over the course of four months. Even if the cities in Malawi had murder rates of 150 per 100,000, nearly triple the rate of the US city with the most murders per person, we would expect to see 7.5 murders a year and at least 1 or 2 over the course of 4 months. I heard about zero. I discussed a wide range of crimes, including some shootings, with local authorities there, but no homicides whatsoever.

Data nerds such as myself like to talk about using the “smell test” on their results, and frankly this number just stinks every way I sniff it. Another way it smells is that nationwide, 36 murders per 100,000 people is about 100 murders per week. There are definitely murders reported in the Malawian press, but I would venture that I see about 1 or 2 per week, not 100. Alternatively, we can look at the distribution of all causes of death. Malawi has a death rate of 1350 per 100,000 people, so according to the UNODC murders cause 2.7% of all deaths in the country. That would mean that murder would rank above tuberculosis and ischemic heart disease in this ranking of the top ten causes of death in Malawi. Incidentally, it would also mean murder should itself be on that list, knocking off malnutrition.
The Wikipedia article has numerous caveats and hedges, including the suggestion that the data may include attempted murders as well as successful ones. However, it also has a link to the underlying table from the UN Office on Drugs and Crime. Annoyed by my inability to square the reported murder rate with other facts about Malawi, I decided to see where they were getting it from. In the footnotes, they attribute it to the World Health Organization Global Burden of Disease Mortality Estimates. After digging through the WHO website, I came to this page where one can download the datasets used for the Global Burden of Disease calculations. These are files that contain observations by year, country, gender, and disease, where disease is represented by an ICD code (there are different files for the ICD-7, ICD-8, ICD-9, and ICD-10 codes). If you know the ICD code you want you can look up total deaths as well as deaths by age bracket.
I didn’t get that far, though: none of the files have any entries for Malawi, and the data availability index doesn’t list Malawi data for any year. There is a country code for Malawi (1270) but it doesn’t actually appear to get used. I can’t say for certain where the claim of 36 murders per 100,000 people comes from, but I can tell you it’s definitely not from the WHO Mortality Database.
Now, any number of things could have gone wrong here. Maybe I took a wrong turn as I hunted for the WHO data the UNODC rely on, or overlooked something else obvious. It’s also possible that entries got miscoded, either in the UNODC or the WHO files, leading me astray. Or maybe there was private communication between those two UN offices, and the underlying data actually isn’t public.
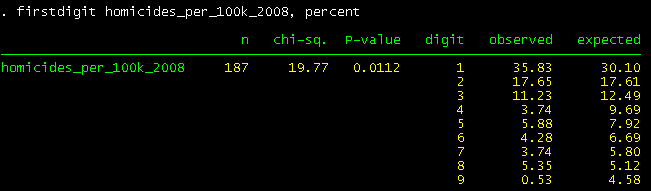
Fortunately, there are tricks I can use even when I can’t get my hands on the actual data. Back in 1938, Frank Benford observed that many datasets have the property that the leading digits of numbers (the “7” in “743”, for example) are logarithmically distributed, and death rates were actually one of the examples he leaned on in demonstrating what we now call “Benford’s Law”. If the law holds exactly, we’d expect 30.1% of leading digits to be “1”s, 17.6% to be “2”s, and so on, with a known, predictable percentage for each digit. And we can run a statistical test to see if deviations from the expected pattern are large enough to be meaningful, or are just random fluctuations. Using the firstdigit package in Stata, I ran this test on the UNODC spreadsheet’s mortality rates from 2008, which is the most-populated year in the table. As you can see, there are more leading “1”s than we’d expect under Benford’s Law, and across all digits the deviation from Benford is statistically significant at the 5% level – the p-value is 0.011, so we’re just barely above the cutoff to get 3 stars in a journal article.
It’s possible to delve deeper: what I’m really curious about is not all the statistics – it would be hard to get the ones for big countries like the US wrong – but specifically the figures attributed to the WHO Global Burden of Disease. If I break the data down into observations that list “WHO” as the source and everything else, only the WHO data looks suspicious (p=0.040), while everything else conforms reasonably well to Benford’s Law (p=0.214).* Or I can use the slightly-broader “PH” category for all public health-derived rates. Those look iffy (p=0.025) whereas the non-PH murder rates look alright (p=0.154). What’s more these aren’t just cases of large samples helping me to find spurious “statistically significant” effects: there are just 61 values coded PH in the data, and 187 overall.
The takeaway from that is that not just the Malawi murder but all the UNODC data supposedly derived from public health sources is questionable. I’m not trying to claim that these statistics were necessarily faked intentionally. I can imagine a number of ways they could have been screwed up by mistake. There might even be some reason why Benford’s Law would hold for some of these murder rates and not for others. Even if there was intent I have no idea who might have been responsible. What I am trying to claim is that they shouldn’t be taken seriously, or relied on for anything of importance, until someone can verify their source. And I do think this matters. People rely on these numbers, and draw judgments based on them. A glance at the top-ranking countries on Wikipedia’s list, would, for example, neatly confirm someone’s preconceived notions about Africa being a violent place. The top three African countries on that list are Zambia, Uganda, and Malawi – all have their statistics attributed to the WHO, and none actually appear in the WHO mortality data.
EDIT: I changed the Wikipedia article to remove the entries that I tried to trace down but could not find, until the source of the UNODC numbers is located or they are replaced with something better (Nameless has a suggestion in this post’s comments).